Group-Sparse Total-Variation Denoising (GS-TVD) : Example 1
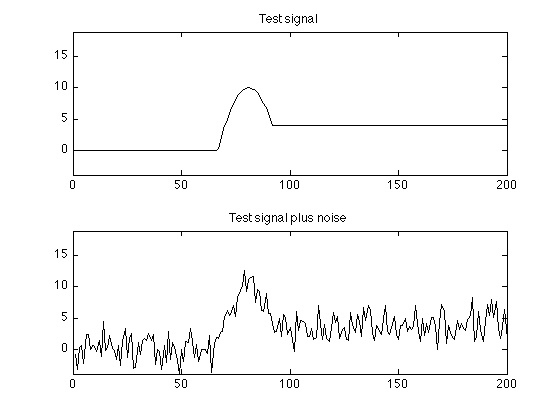
Comparison of TV denoising and group-sparse TV denoising. The test signal consists of a pulse.
Ivan Selesnick, selesi@poly.edu, 2012
Contents
Start
clear
close all

printme = @(filename) print('-dpdf', sprintf('figures/Example1_%s', filename));

set(0,'DefaultAxesColorOrder', [1 1 1]*0);   % make all plot lines black
Make test signal
N = 200;                        % N : signal length
n = 0:N-1;

s = max( 4*(n > 80), 10 - 0.05*(n-80).^2);
s = 10*s/max(s);
s = s(:);                       % s : noise-free signal

randn('state',0);               % Set state so that example is reproducible
noise = 2.0*randn(size(s));     % zero-mean Gaussian noise
y = s + noise;                  % y : signal plus noise


% Display noise-free signal, s
figure(1)
clf
subplot(2,1,1)
plot(s)
ax1 = [0 N -4 19];
axis(ax1)
title('Test signal');

% Display noisey signal, y
subplot(2,1,2)
plot(y)
axis(ax1)
title('Test signal plus noise');
printme('input')
TV Denoising (TVD)
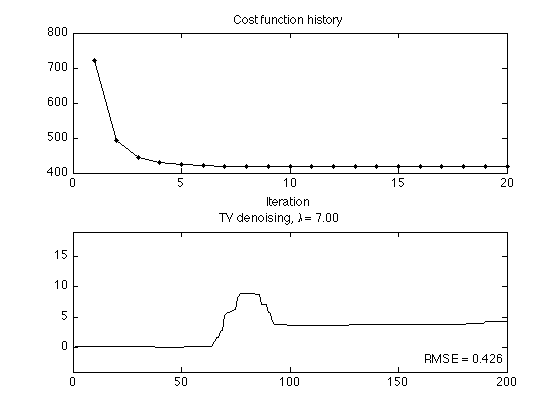
Perform total-variation denoising
lam1 = 7;                           % lam1 : regularization parameter
Nit = 20;                           % Nit : number of iterations
[x1, cost] = tvd(y, lam1, Nit);     % TV denoising algorithm

txt1 = sprintf('TV denoising, \\lambda = %.2f', lam1);
rmse_tv = sqrt( mean( (s - x1).^2 ) )
txt_rmse_tv = sprintf('RMSE = %.3f', rmse_tv);

% Display cost function to verify convergence
figure(2)
clf
subplot(2,1,1)
plot(1:Nit, cost, '.-')
title('Cost function history');
xlabel('Iteration')

% Display output of TV denoising
subplot(2,1,2)
plot(x1)
axis(ax1)
title(txt1);
axnote(txt_rmse_tv)
printme('TVD')
rmse_tv =

    0.4263
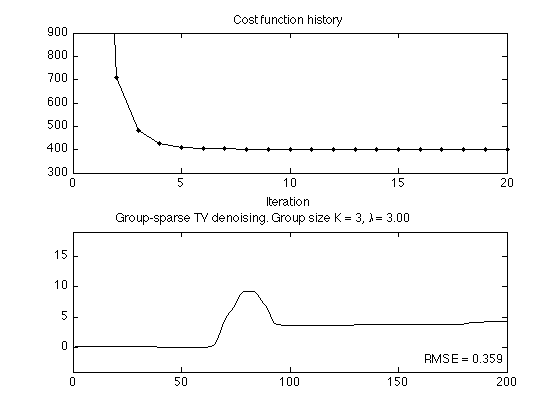
Group-sparse TV Denoising (GS-TVD)
Perform group-spase total-variation denoising on the same noisy signal. The group size is K = 3.
K = 3;                                  % K : group size
lam = 3.0;                              % lam : regularlization parameter
[xg, costg] = gstvd(y, K, lam, Nit);    % GS-TVD algorithm

txtg = sprintf('Group-sparse TV denoising. Group size K = %d, \\lambda = %.2f', K, lam);
rmse_tvgs = sqrt( mean( (s - xg).^2 ) )
txt_rmse_tvgs = sprintf('RMSE = %.3f', rmse_tvgs);

% Display cost function history to verify convergence
figure(1)
clf
subplot(2,1,1)
plot(costg,'.-')
title('Cost function history');
xlabel('Iteration')
ylim([300 900])

% Display output of GS-TVD
subplot(2,1,2)
plot(xg)
axis(ax1)
title(txtg);
axnote(txt_rmse_tvgs)
printme('GSTVD')
rmse_tvgs =

    0.3589
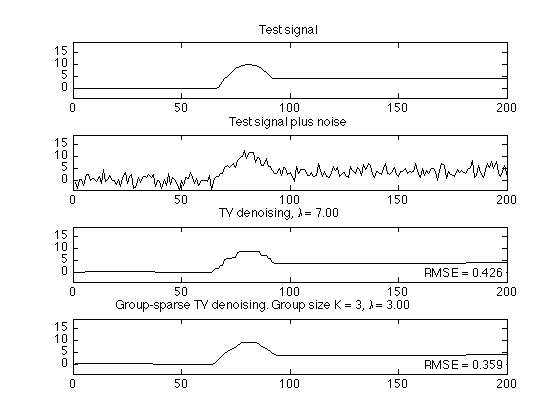
Display signals
figure(10)
clf

subplot(4,1,1)
plot(s)
axis(ax1)
title('Test signal');

subplot(4,1,2)
plot(y)
axis(ax1)
title('Test signal plus noise');

subplot(4,1,3)
plot(x1)                    % plot TVD output
axis(ax1)
title(txt1);
axnote(txt_rmse_tv)

subplot(4,1,4)
plot(xg)                    % plot GS-TVD denoising output
axis(ax1)
title(txtg);
axnote(txt_rmse_tvgs)

orient tall
printme('signals')
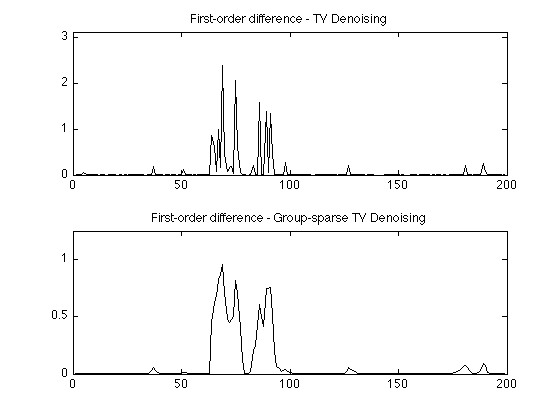
Show first-order difference
The first-order difference function of the output of TVD and GS-TVD emphasize the difference between the two denoising methods.
figure(1)
clf
subplot(2,1,1)
plot(abs(diff(x1)))
xlim([0 N])
ylim([0 1.3*max(abs(diff(x1)))])
title('First-order difference - TV Denoising');

subplot(2,1,2)
plot(abs(diff(xg)))
xlim([0 N])
ylim([0 1.3*max(abs(diff(xg)))])
title('First-order difference - Group-sparse TV Denoising');

printme('diff')
set(0,'DefaultAxesColorOrder', 'remove');