Putting pi on the line
How to use 'pi' as an xtick label
Contents
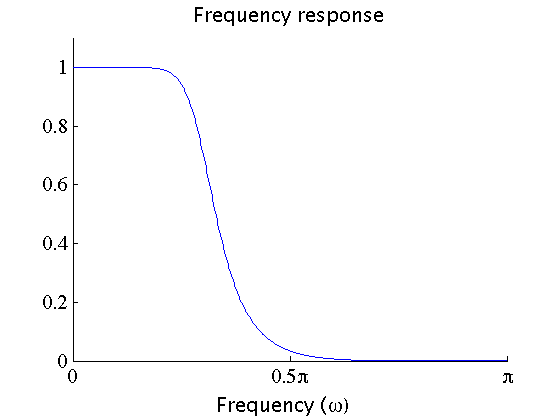
Make a filter
% This is a Butteworth low-pass filter with cut-off frequency at 0.3 pi.
[b, a] = butter(5,0.3);
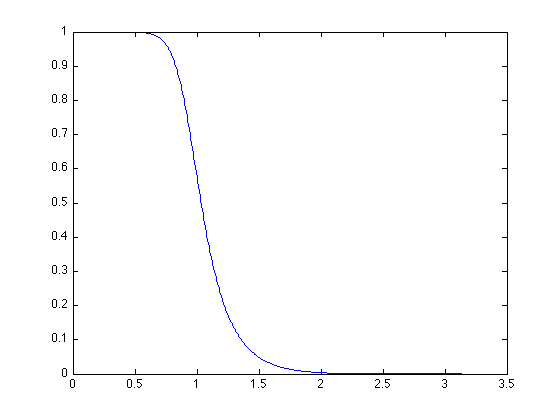
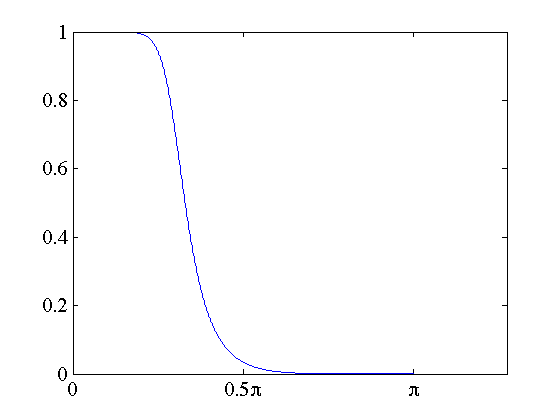
Frequency response plot
[H,w] = freqz(b,a);

close all

figure(1), clf
p1 = plot(w, abs(H));
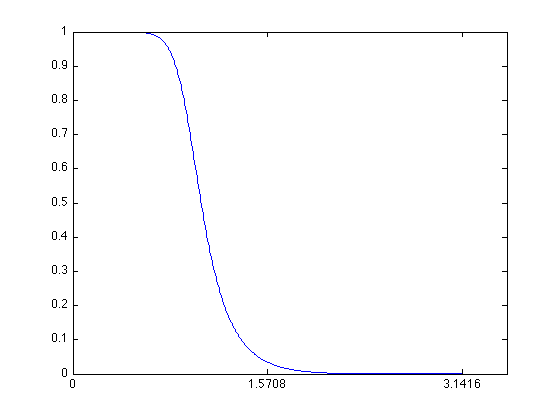
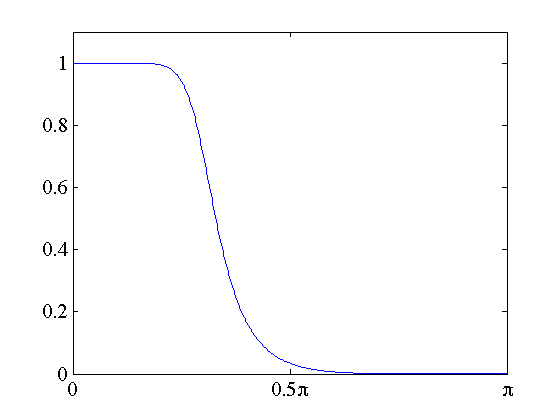
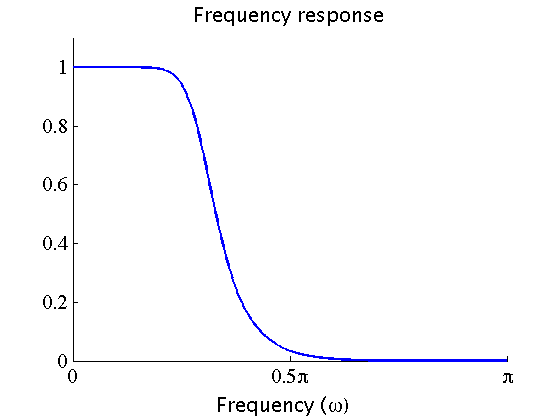
Use 0, pi/2, and pi as xticks
'gca' means 'get current axis' You can set parameters of the graph using 'set'
set(gca, 'xtick', [0, pi/2, pi]);
Change xtick labesl
set(gca, 'xtickLabel', {'0', '0.5p', 'p'})
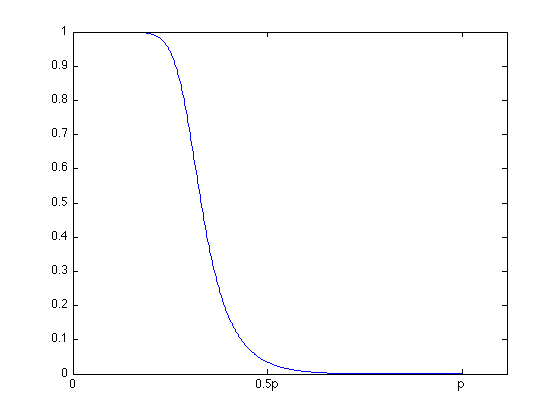
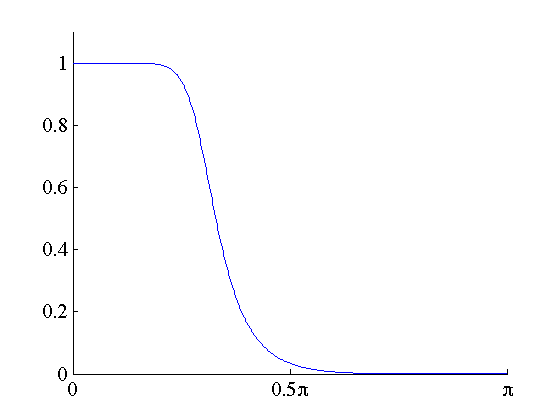
Change font
set(gca, 'Fontname', 'symbol')
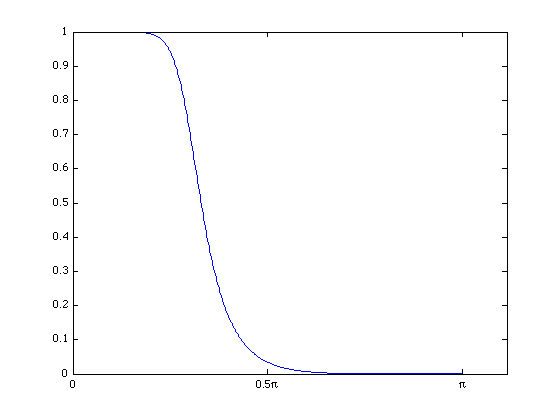
Increase font size
set(gca, 'Fontsize', 16)
Change axis limits
Notice that the horizontal axis extends beyond pi (ugly!)
xlim([0 pi])
ylim([0 1.1])       % some space is nice on top
Turn off box
box off
labels
h1 = xlabel('Frequency (\omega)');
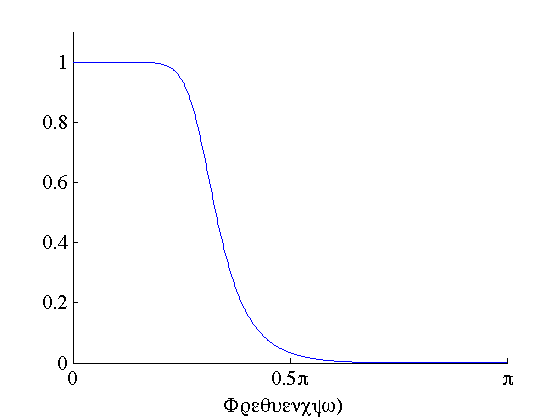
Ooh, the xlabel font is 'symbol'. Lets change it:
set(h1, 'Fontname', 'Helvettica')

h2 = title('Frequency response');
set(h2, 'Fontname', 'Helvettica')
Lets make the frequency response curve thicker
for better visibility
set(p1, 'LineWidth', 2)
Export figure to a file
Matlab can save to a pdf file. Then there are no pixels in the graphics file - it has infinite resolution!
print -dpdf xtickpi_figure
Other parameters
You can see what parameters are available using 'get'
get(gca)
	ActivePositionProperty = outerposition
	ALim = [0 1]
	ALimMode = auto
	AmbientLightColor = [1 1 1]
	Box = off
	CameraPosition = [1.5708 0.55 17.3205]
	CameraPositionMode = auto
	CameraTarget = [1.5708 0.55 0]
	CameraTargetMode = auto
	CameraUpVector = [0 1 0]
	CameraUpVectorMode = auto
	CameraViewAngle = [6.60861]
	CameraViewAngleMode = auto
	CLim = [0 1]
	CLimMode = auto
	Color = [1 1 1]
	CurrentPoint = [ (2 by 3) double array]
	ColorOrder = [ (7 by 3) double array]
	DataAspectRatio = [2.85599 1 1.81818]
	DataAspectRatioMode = auto
	DrawMode = normal
	FontAngle = normal
	FontName = symbol
	FontSize = [16]
	FontUnits = points
	FontWeight = normal
	GridLineStyle = :
	Layer = bottom
	LineStyleOrder = -
	LineWidth = [0.5]
	MinorGridLineStyle = :
	NextPlot = replace
	OuterPosition = [0 0 1 1]
	PlotBoxAspectRatio = [1 1 1]
	PlotBoxAspectRatioMode = auto
	Projection = orthographic
	Position = [0.13 0.140476 0.775 0.769048]
	TickLength = [0.01 0.025]
	TickDir = in
	TickDirMode = auto
	TightInset = [0.0535714 0.140476 0.0125 0.0904762]
	Title = [175.01]
	Units = normalized
	View = [0 90]
	XColor = [0 0 0]
	XDir = normal
	XGrid = off
	XLabel = [172.01]
	XAxisLocation = bottom
	XLim = [0 3.14159]
	XLimMode = manual
	XMinorGrid = off
	XMinorTick = off
	XScale = linear
	XTick = [0 1.5708 3.14159]
	XTickLabel = [ (3 by 1) cell array]
	XTickLabelMode = manual
	XTickMode = manual
	YColor = [0 0 0]
	YDir = normal
	YGrid = off
	YLabel = [173.01]
	YAxisLocation = left
	YLim = [0 1.1]
	YLimMode = manual
	YMinorGrid = off
	YMinorTick = off
	YScale = linear
	YTick = [0 0.2 0.4 0.6 0.8 1]
	YTickLabel =
		0
		0.2
		0.4
		0.6
		0.8
		1
	YTickLabelMode = auto
	YTickMode = auto
	ZColor = [0 0 0]
	ZDir = normal
	ZGrid = off
	ZLabel = [174.01]
	ZLim = [-1 1]
	ZLimMode = auto
	ZMinorGrid = off
	ZMinorTick = off
	ZScale = linear
	ZTick = [-1 0 1]
	ZTickLabel =
	ZTickLabelMode = auto
	ZTickMode = auto

	BeingDeleted = off
	ButtonDownFcn =
	Children = [171.01]
	Clipping = on
	CreateFcn =
	DeleteFcn =
	BusyAction = queue
	HandleVisibility = on
	HitTest = on
	Interruptible = on
	Parent = [1]
	Selected = off
	SelectionHighlight = on
	Tag =
	Type = axes
	UIContextMenu = []
	UserData = []
	Visible = on